In this article, which is the third in a four-part JumboSwitch education series with corresponding videos, we will explore the third JumboSwitch management feature, TCView, and provide a look at common user interface pages.
TC Communications’ JumboSwitch® offers four key troubleshooting, monitoring, and network management features:
- “Troubleshooting at a glance” using LED units on the front panel
- The built-in graphical user interface
- Our TCView® network management system
- SNMP (Simple Network Management Protocol) integration with third-party network management systems
Overview
TCView, a network management system, is a powerful tool designed specifically for JumboSwitch products, and it contains a number of key monitoring and management aspects that allow you better control over your JumboSwitch solution.
While the JumboSwitch does have the capability to connect to third-party management systems—such as SolarWinds—using SNMP (Simple Network Management Protocol), doing so doesn’t provide you with the full range of monitoring potential that you get using TCView.
TCView excels in five particular areas: temperature and power monitoring, communication channel latency, automatic alerts, broader network monitoring, and asset management.
Temperature and Power (Tx and Rx) Monitoring
Temperature monitoring may seem overly simple and easy to overlook, but it can provide valuable insights that assist in troubleshooting. TCView allows you to access the full temperature monitoring for your systems. Each of the cards has a temperature monitoring device attached to it. A rise in temperature is often an indicator of an issue that may cause faults to occur within your system.
Similarly, TCView has the capability to monitor the power of transmitted and received signals used for the optical fiber. The management card uses specifically designed SFPs which enable you to monitor both the temperature and the power of the optical fiber.
Communication Channel Latency
With an IP solution, one of the key benefits of the JumboSwitch is consistent communication channel latency. If you navigate to the Performance tab at the top of TCView and select “Latency” from the options that appear below, from this page, you can monitor the communication latency channel-by-channel.
Automatic Alerts
Naturally, you won’t always be sitting in front of TCView, waiting for it to show a system error. For that reason, TCView enables automatic email alerts, which can be converted to text alerts so that you can stay up to date on troubleshooting issues when you’re away from your workspace.
These automatic alerts notify your members of staff that there has been a problem. What’s more, all alarms are individually configurable, so you can choose to whom the alarms go and which specific alarms they are.
This way, you can categorize alerts into various levels of alarms so that you won’t fill up your inbox with only general alerts. TCView alerts are designed for convenience and efficiency: only receive what you need, when you need it.
Broader Network Monitoring
Since nothing exists in a vacuum, at times, the performance of your system may be affected by factors outside of the units deployed in your system. For this reason, TCView allows you to monitor not only the actual interface cards, but also lets you manage the VLAN and QoS (quality of service) of the Ethernet service itself.
This way, you can isolate external factors from potential faults within the system, which can inform your decisions surrounding which network services you rely on.
Asset Management
The JumboSwitch and TCView have been designed to help you spend far less time on maintenance. Under the Asset Management section in TCView, you can access items such as the software versions of each of the cards, which you can upgrade remotely to the latest version.
Not only can you view the status of your system in real time, but also track firmware versions, store and restore backup configurations, and manage your network, all from a remote location. You won’t need to visit each site for regular maintenance.
A Look Inside TCView
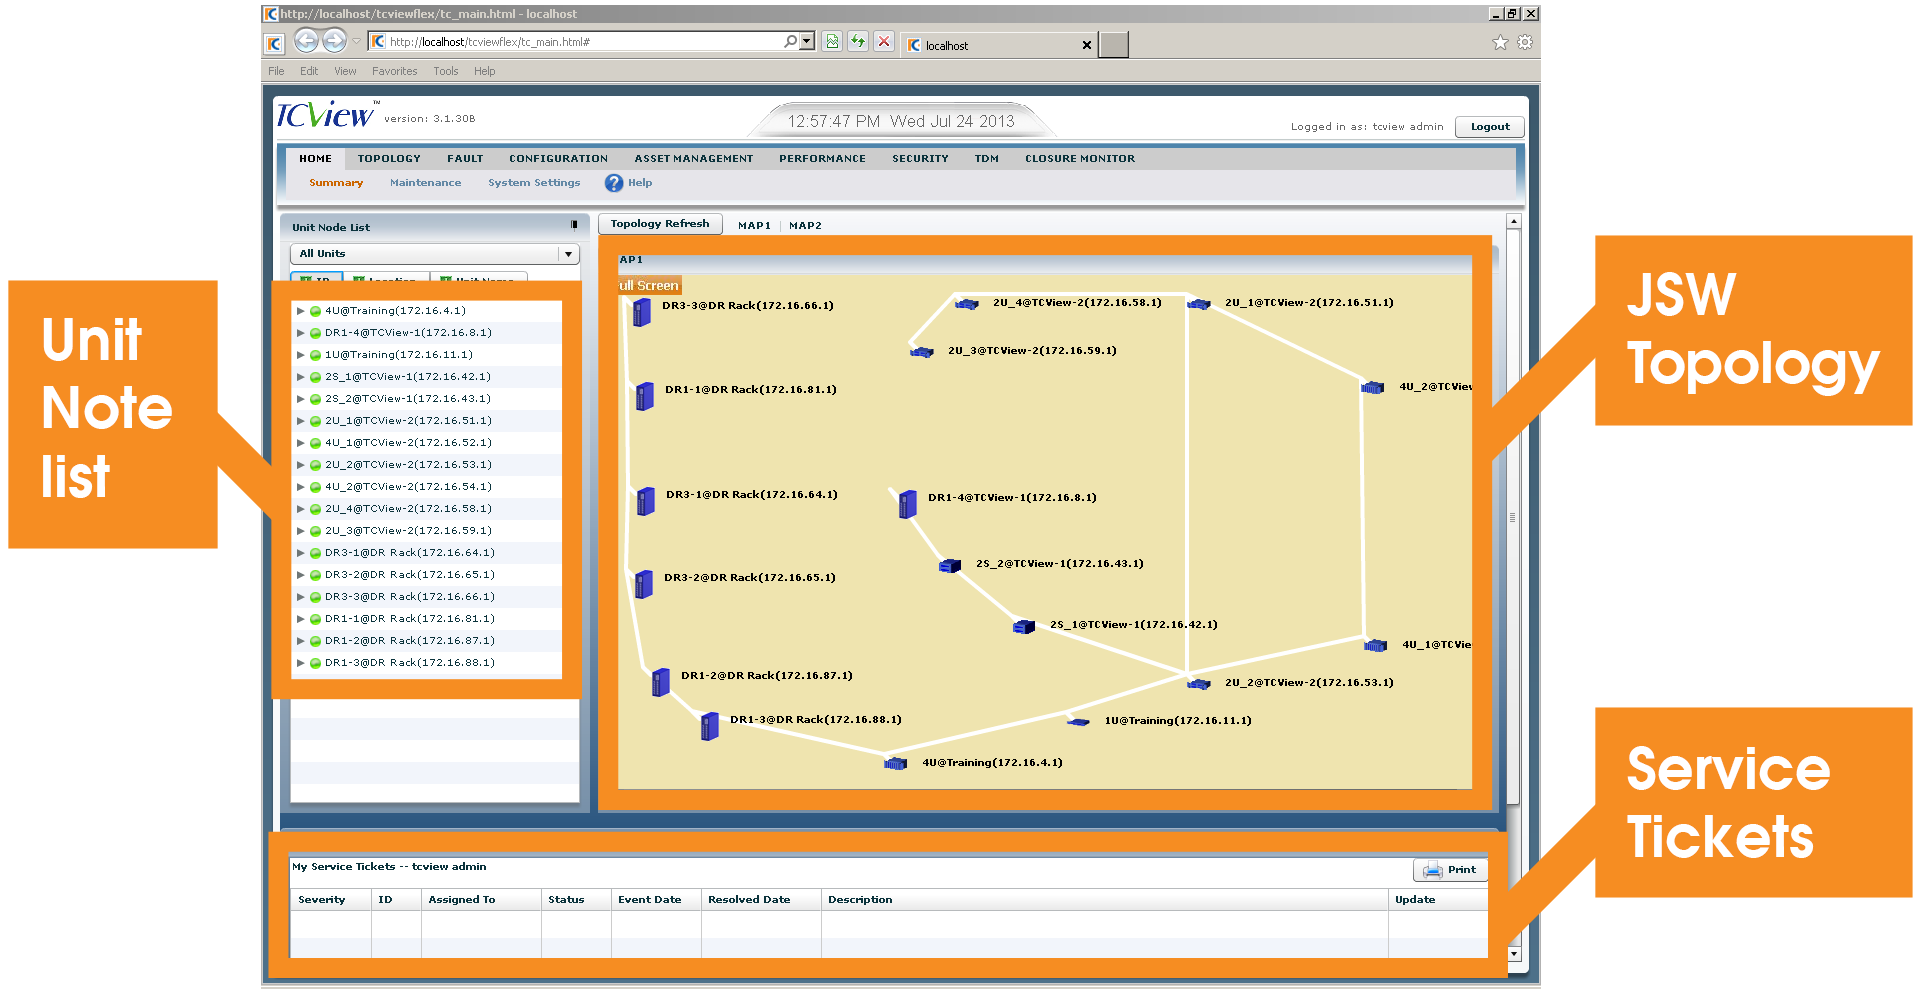
Topology and Service Tickets
From the home screen in TCView, you can view the topology showing the connections between the different sites in your JumboSwitch system. On the left, you’ll find a list of all the nodes and sites; moving your mouse over any of them will highlight its location within the topology. Below the topology screen, you’ll find a chronological list of service tickets that have been submitted.
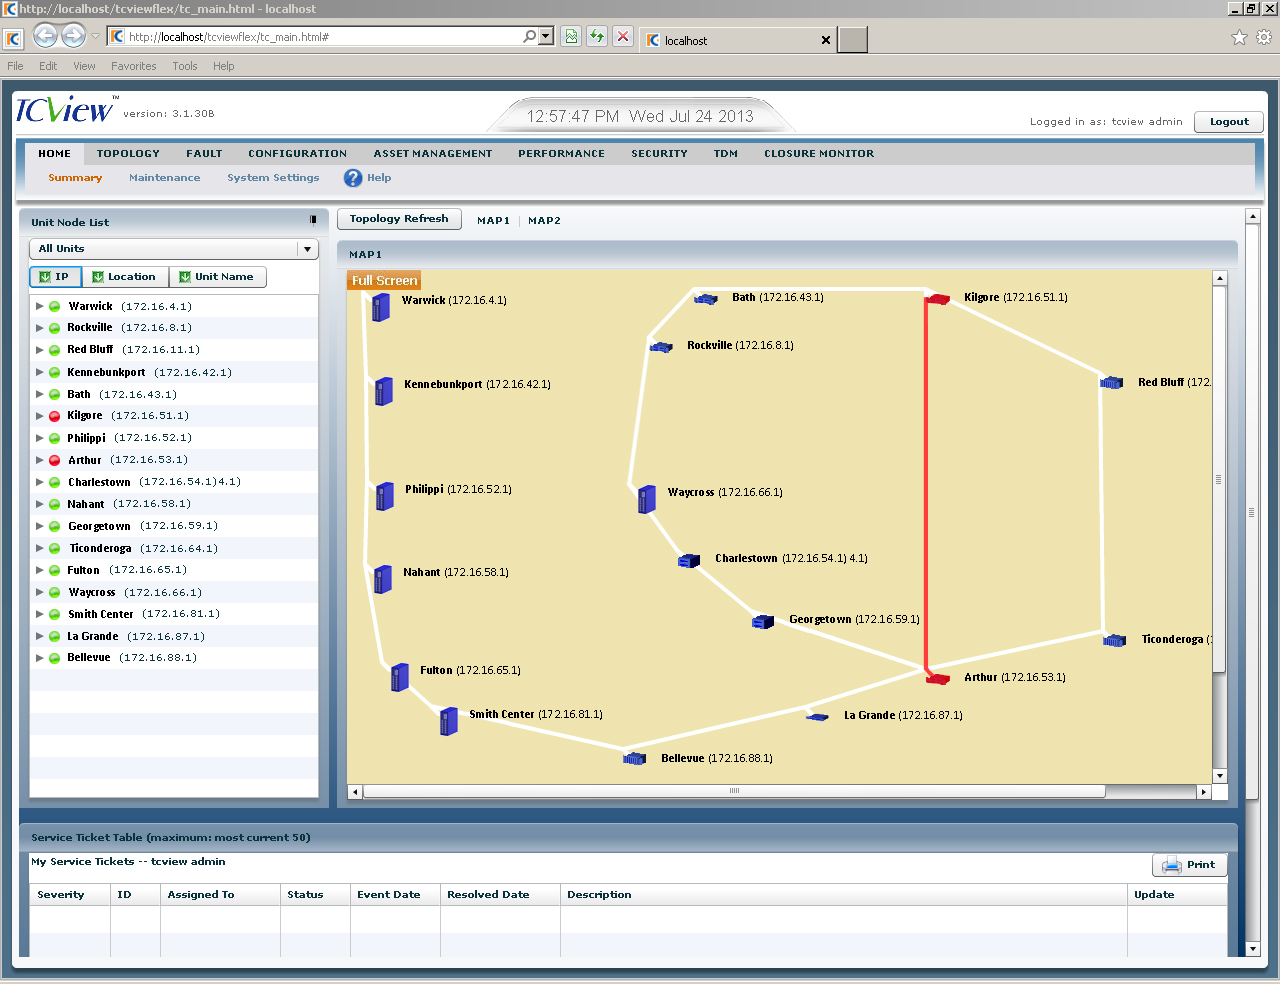
Link Failure
If a connection failure is detected between two sites, the link will be displayed in red within the topology map. Any affected nodes in the node list will also change from green to red to indicate there is a fault.
In the example below, the two disconnected units are part of a ring topology, so those two nodes will still be operational and accessible as communication is automatically routed in a different path.
On the left-hand side in the unit list, you can see which cards and ports are not connected. If you double-click one of the sites, this will take you to a live display and graphical representation of the system rack.
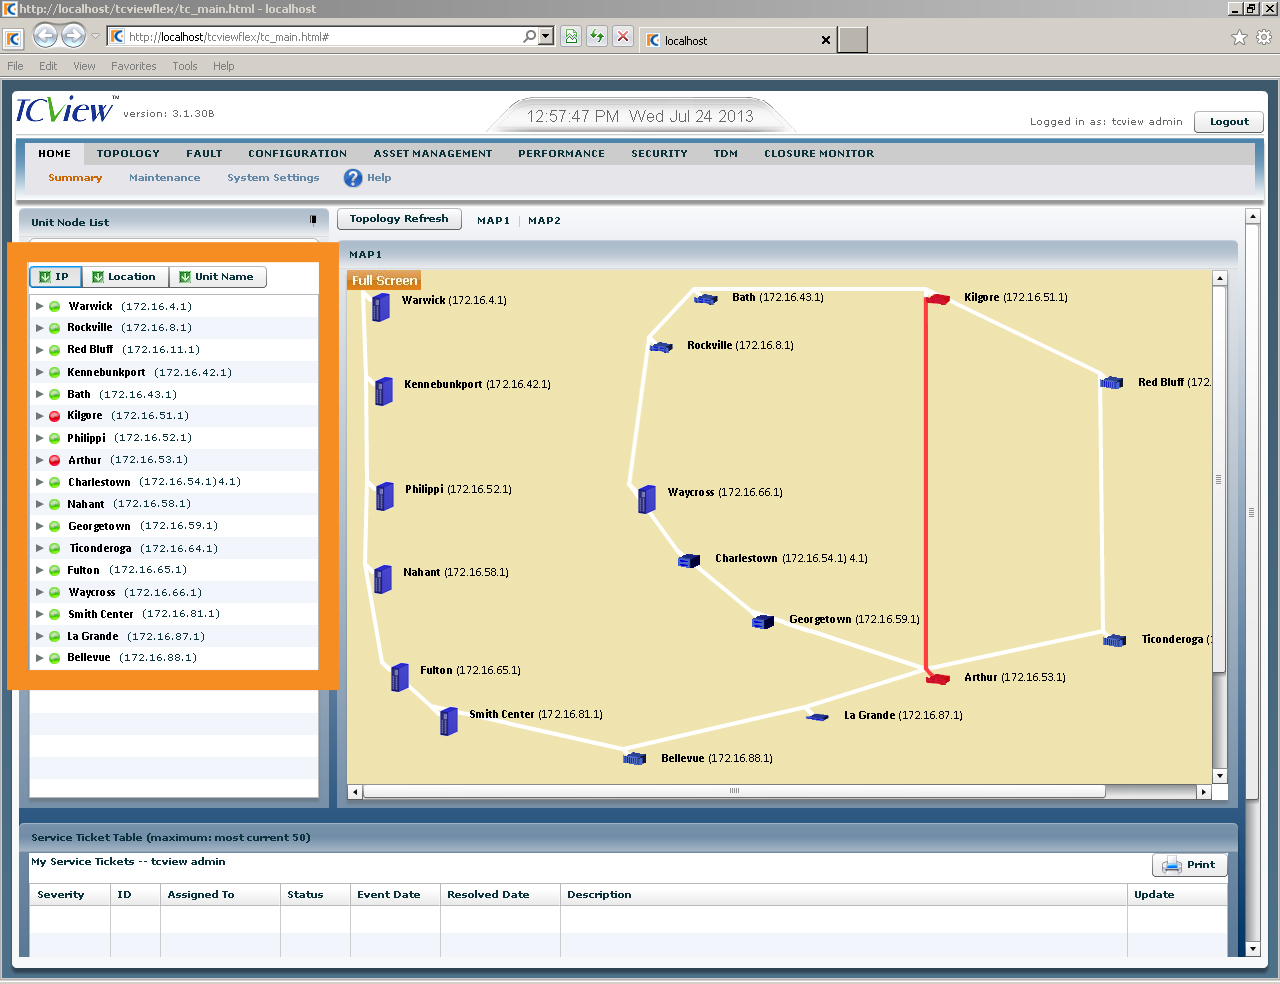
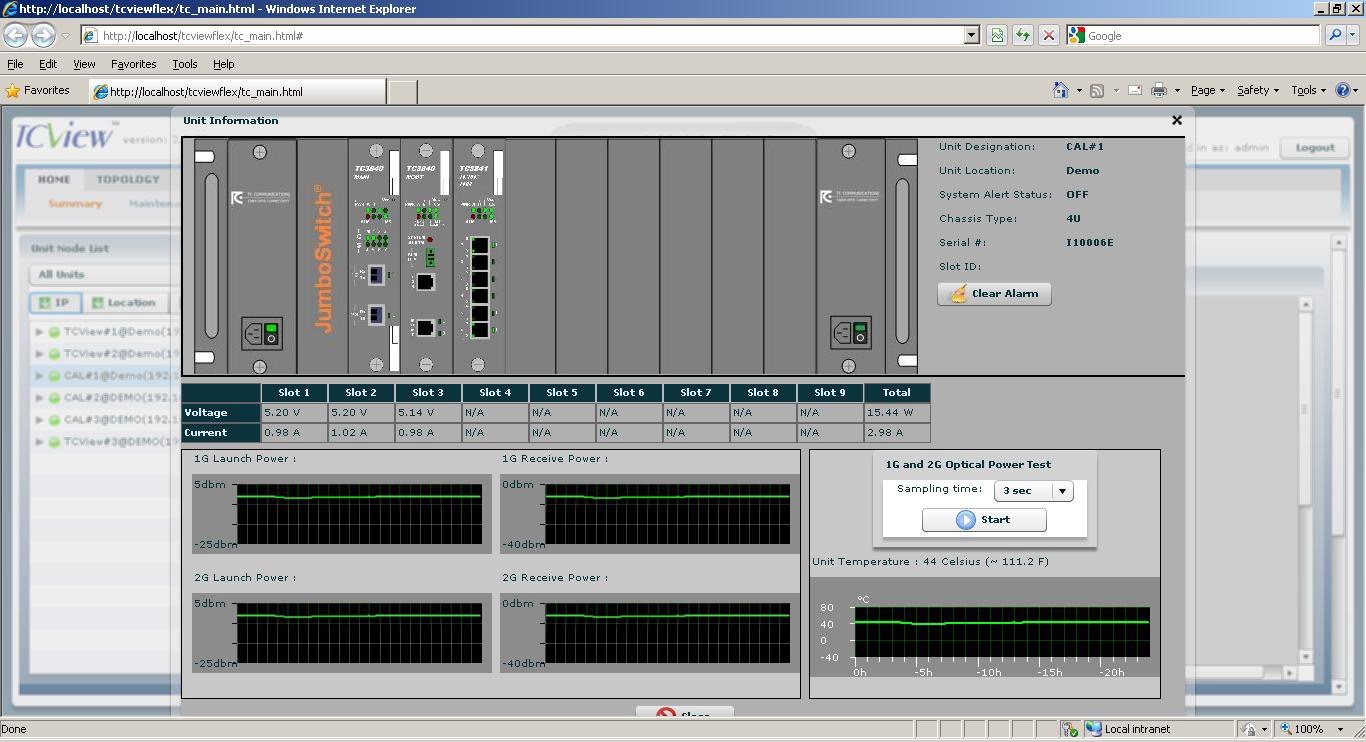
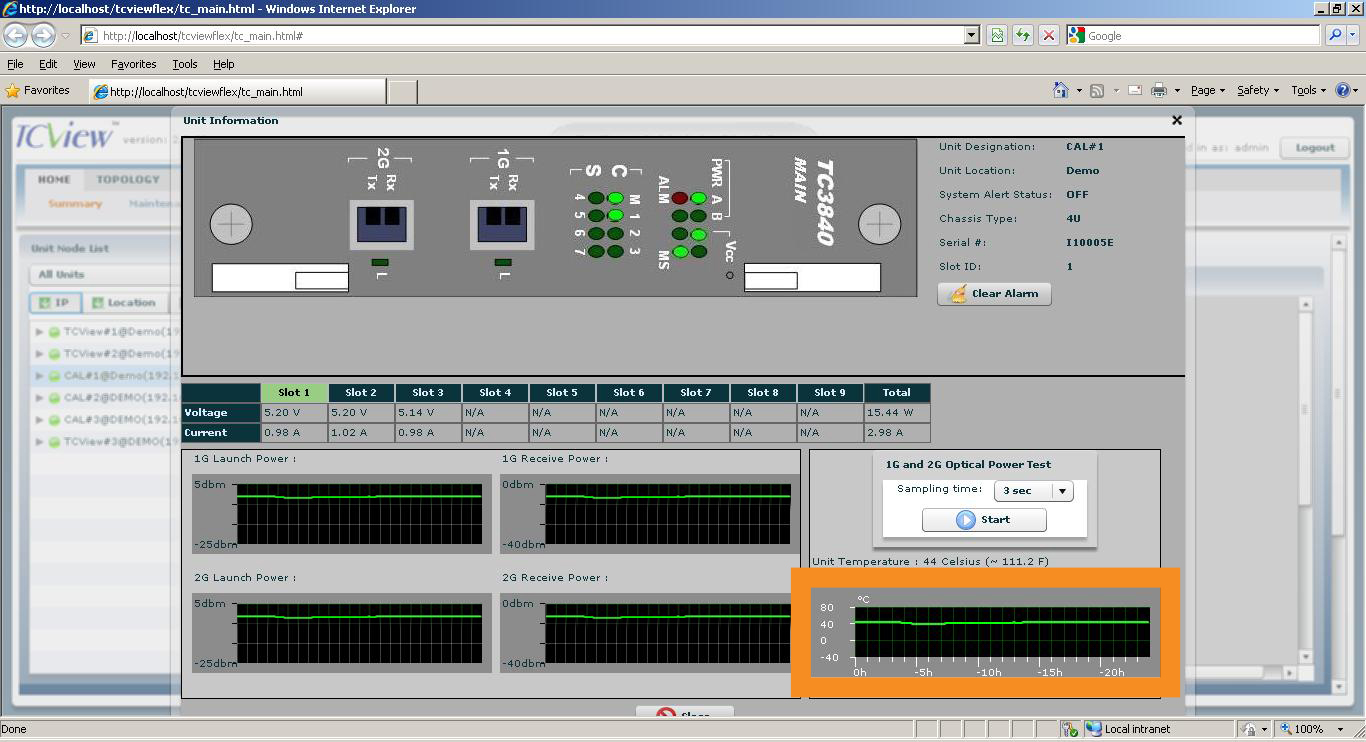
Live Display of System Rack
From the left-hand side in the unit list (above), you can see which cards and ports are not connected. Double-clicking on one of the sites will take you to a live display of the system rack.
On this live display, you can view the live LEDs, the launch and receive power graphs, the unit temperature over time, and asset ID information including the unit designation, unit location, system alert status, and serial number.
Graphical Representation of Individual Cards
You can then double-click on an individual card, which will take you to a real-time graphical representation of the LEDs on that card, including the synchronization on each of the channels, launch and receive power, and temperature.
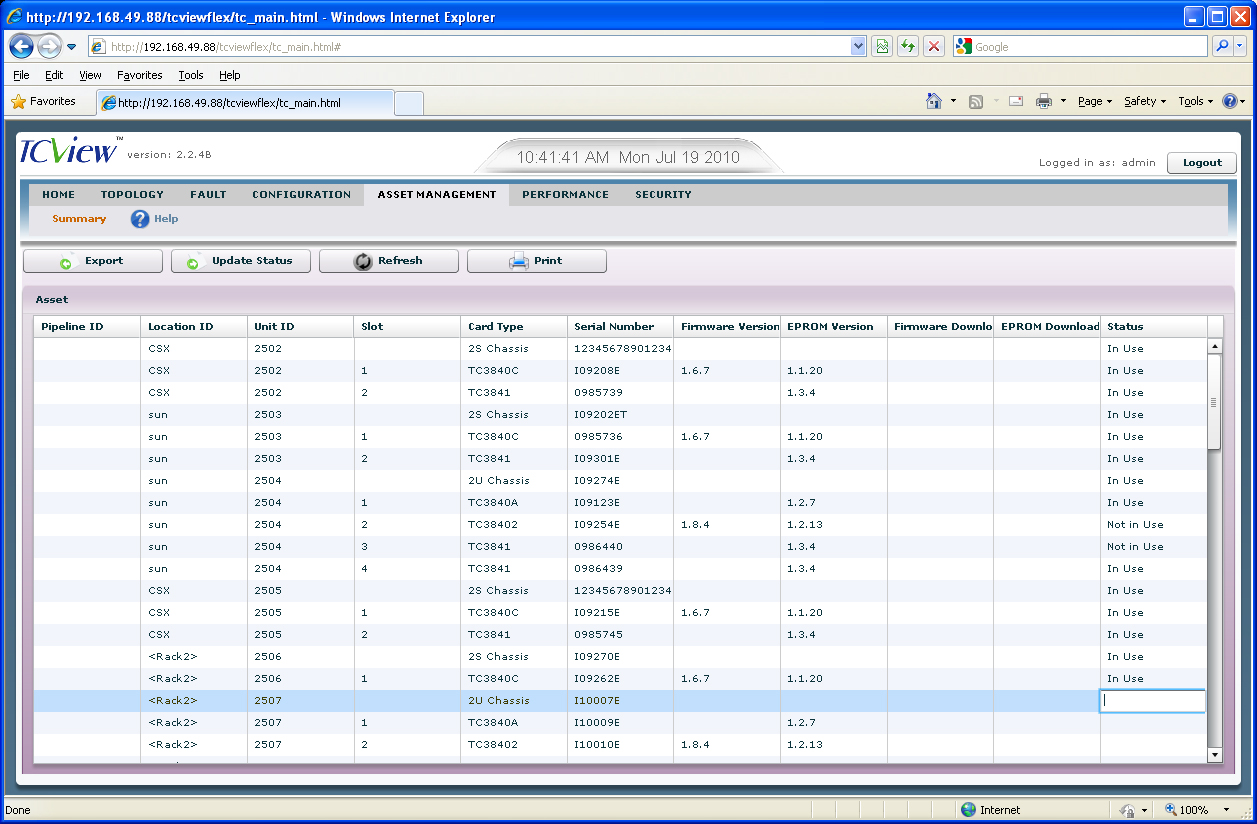
Asset Management Page
As mentioned earlier, the asset management page, which you can navigate by clicking the tab from the tab bar on top of the homepage, provides you with technical and status information for each of your system sites.
Here, you can view items such as location and unit IDs, card types, serial numbers, firmware versions, and EPROM (erasable programmable read-only memory) versions. You can update firmware and store or restore backup configurations to the latest versions.
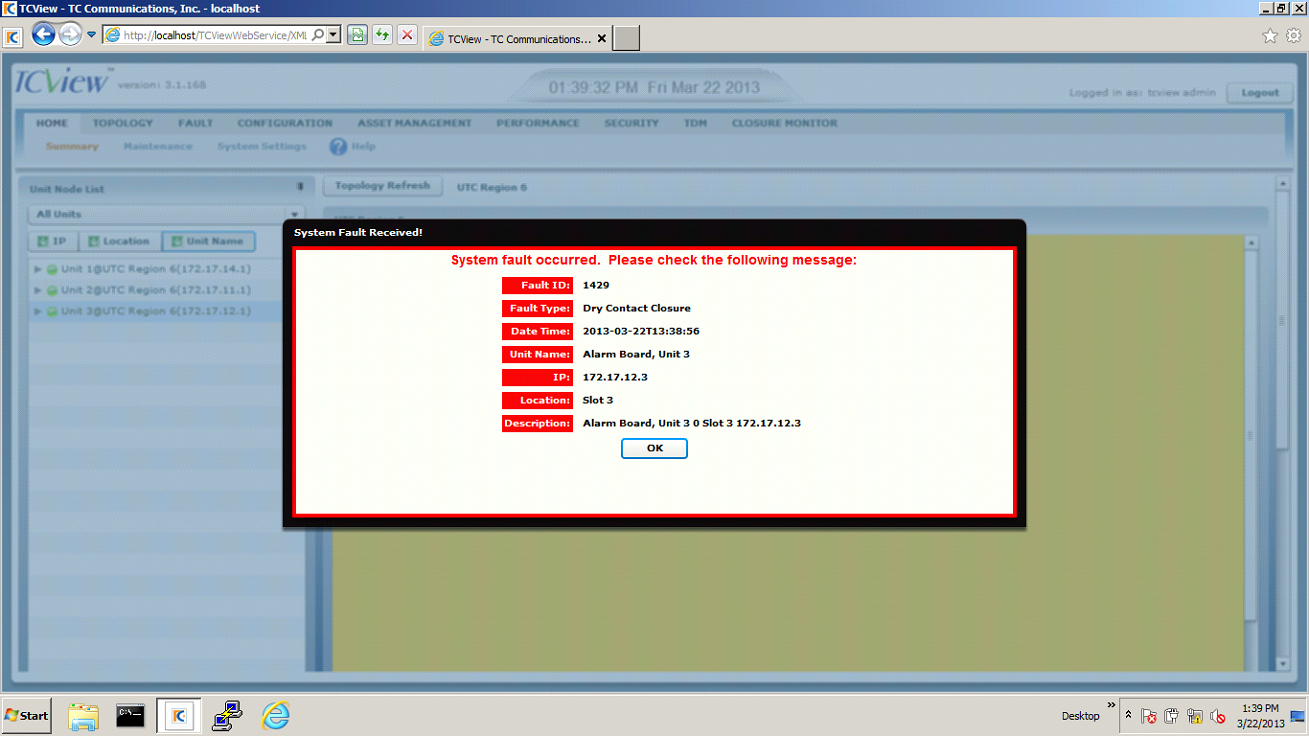
Alarm Status
You can set alarms individually, or use the system’s preset alarm recommendations. Customizing your alarms means only specific individuals on your team need to be notified, which they will receive via email or text. They will not have to be logged into TCView in order to view these alerts.
Below is an example of what an alarm status alert looks like. It immediately informs you that a system fault has occurred, providing pertinent information such as the fault ID, fault type, date and time, unit name, location, and a brief description.
To read other JumboSwitch articles from this series, visit the JumboSwitch Monitoring Series page.
Interested in similar content? Subscribe to our mailing list.