In this article, which is the second in a four-part JumboSwitch education series with corresponding videos, we take a closer look at the second JumboSwitch monitoring feature, the inbuilt graphical user interface (GUI).
TC Communications’ JumboSwitch® offers four key troubleshooting, monitoring, and network management features:
- “Troubleshooting at a glance” using LED units on the front panel
- The built-in graphical user interface
- Our TCView® network management system
- SNMP (Simple Network Management Protocol) integration with third-party network management systems
Overview
The GUI primarily provides three things:
- Monitoring of your system
- Web-based configuration of your cards
- Security
The monitoring allows you to simply plug into one of the cards in the network to access all the cards on the network and perform monitoring on any of those cards.
In addition, using a web browser, you can easily configure all the cards in the system without having to be present at each remote site.
For security, the ability to limit users to certain administration rights is inbuilt for conveniently setting and tracking user permissions. In other words, you have the flexibility to allow certain users in your organization access to some elements of monitoring or configuration, but not others.
Let’s take a closer look at each of these features:
Monitoring
In this example, we have a typical screen showing the user interface for the TC3846-6 four-wire E&M Analog-over-IP card.
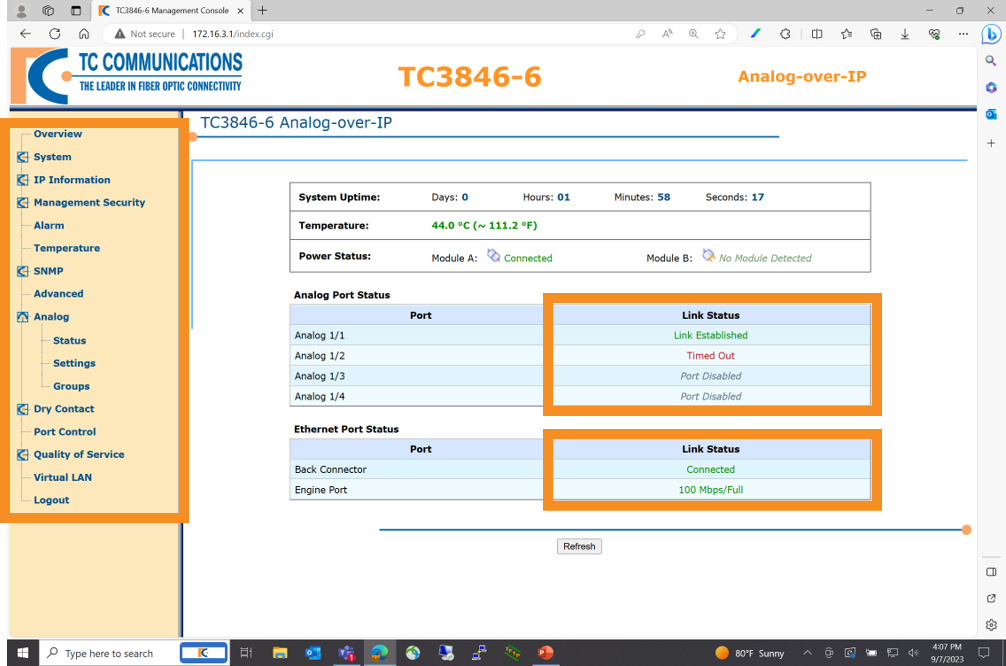
There are a variety of items being monitored, including unit temperature, system uptime, and power status. You can also view which ports on the racks are linked, timed out, or disabled (see upper right box), as well as the link status of the Ethernet port, which may be split into two parts: the back connector and the engine port (lower right box).
On the left, you can find a menu of additional easily navigable options, including IP Information, Security Management, Analog, and Dry Contact. The headers with the TC Communications logo next to them are expandable for additional sub-options.
From the same menu, let’s look at the Analog Status page, which you can find by clicking the “Status” link underneath the Analog header:
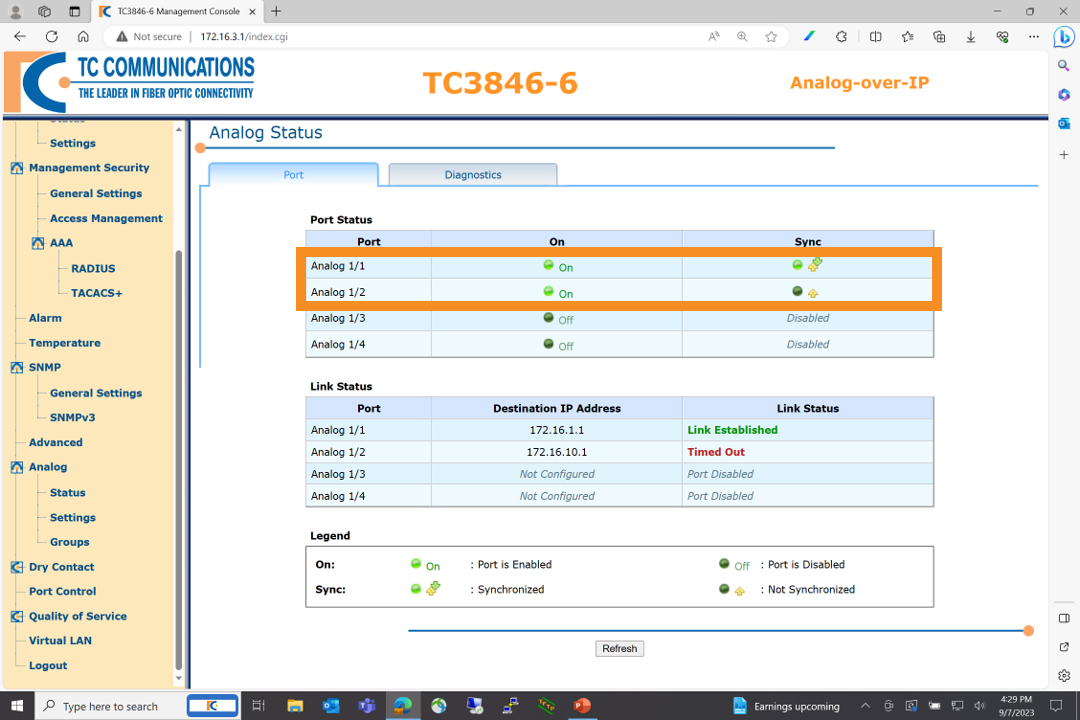
On this page, you can see whether individual ports are on or off, synchronized or unsynchronized, or disabled; in some cases, you may see a combination of statuses. For example, in the Port Status chart above, Analog 1/1 is on and synchronized, while Analog 1/2 is on yet unsynchronized.
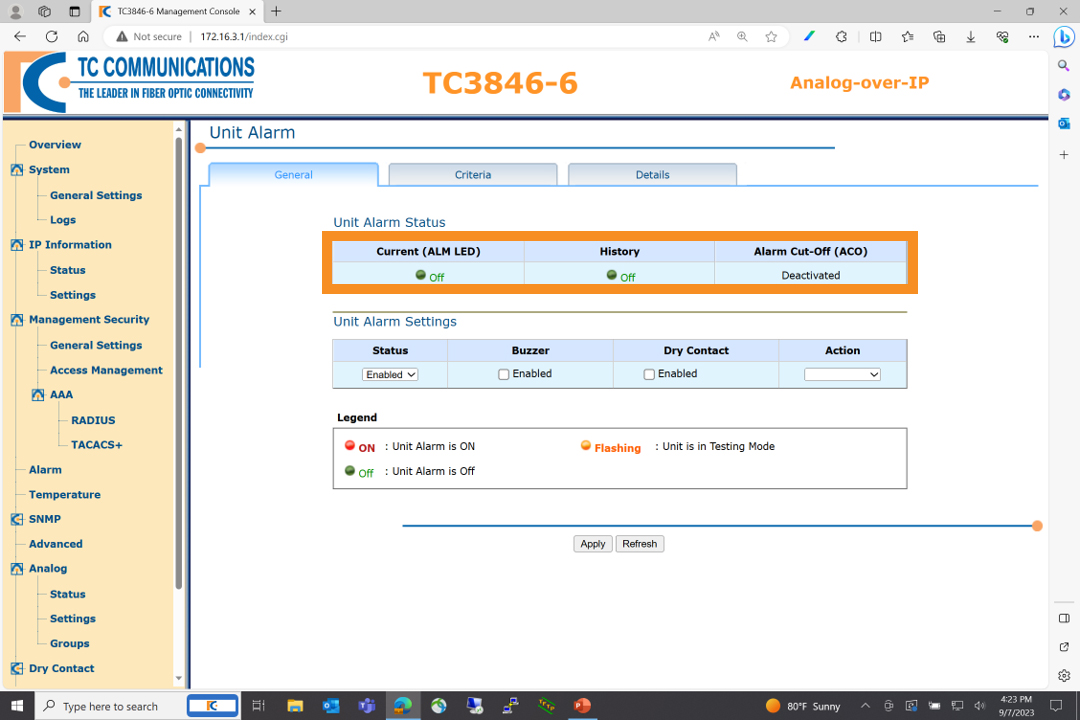
Monitoring and viewing the status of each card is simple and straightforward. Much like how you can check the status of analog ports, you can view the status of dry contacts and alarms in the same way (see below):
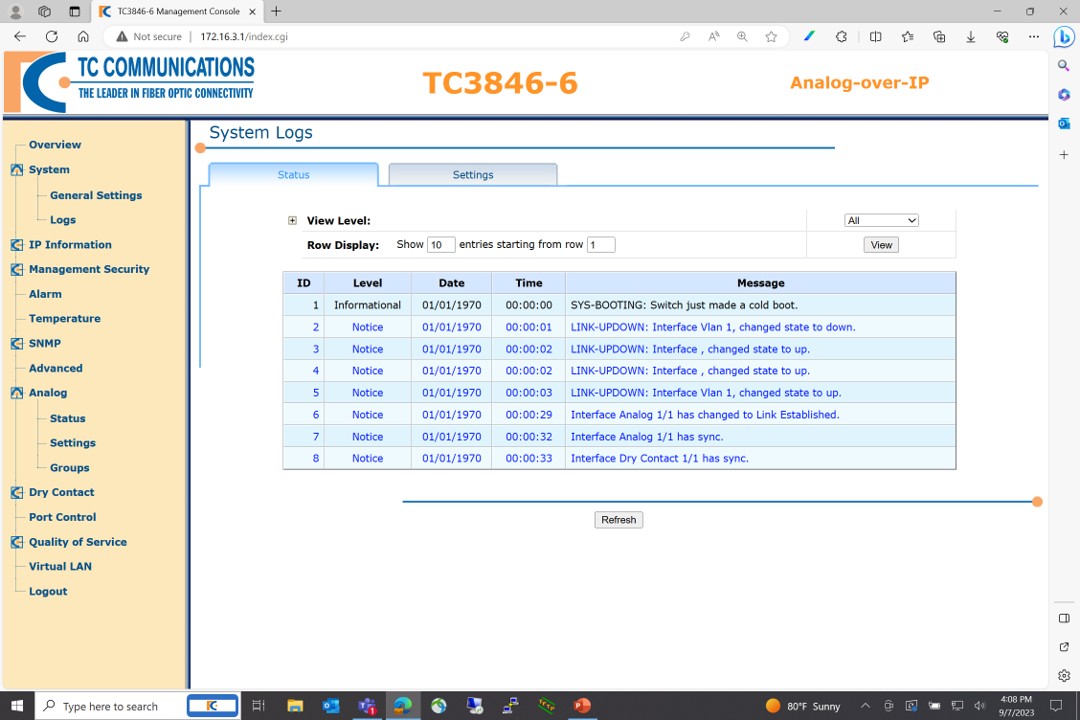
Any alarms or detected problems with operation are stored in a logged file that you can find by clicking “Logs” under the “Systems” header in the left-side menu. Each entry includes the date and time, severity level, and a specific message (see below):Next, let’s go over configuration:
Configuration
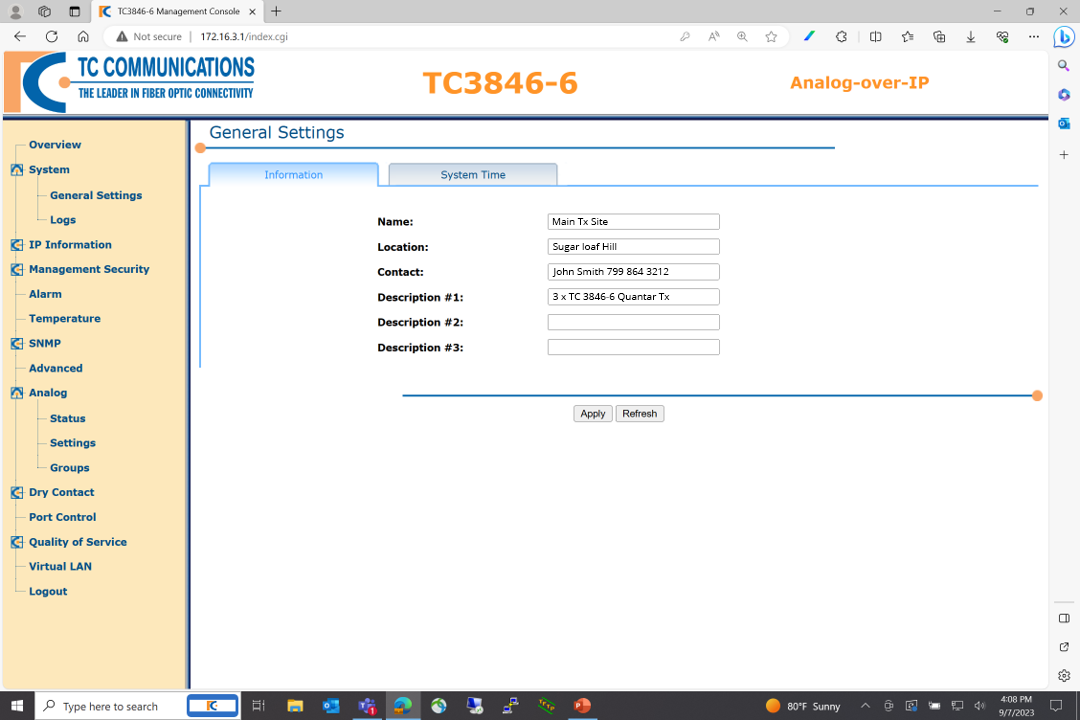
Configuration has also been designed for simplicity. Begin by assigning each card a unique name. In our experience, using unique names is less confusing than using generic names like “Site A, Card 1” and so on. Here, you can also include pertinent information such as the card location, contact person associated with it, and short descriptions of the equipment setup.
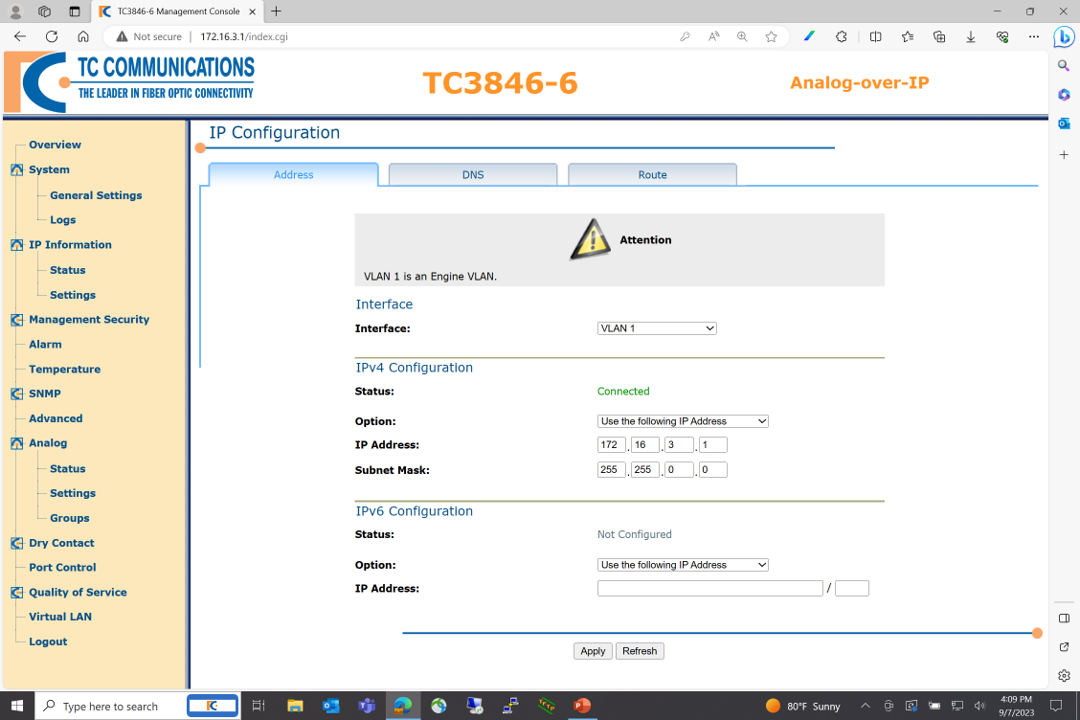
Set up IP addresses by navigating the “Settings” option beneath the IP Information header on the left-side menu, as seen below:
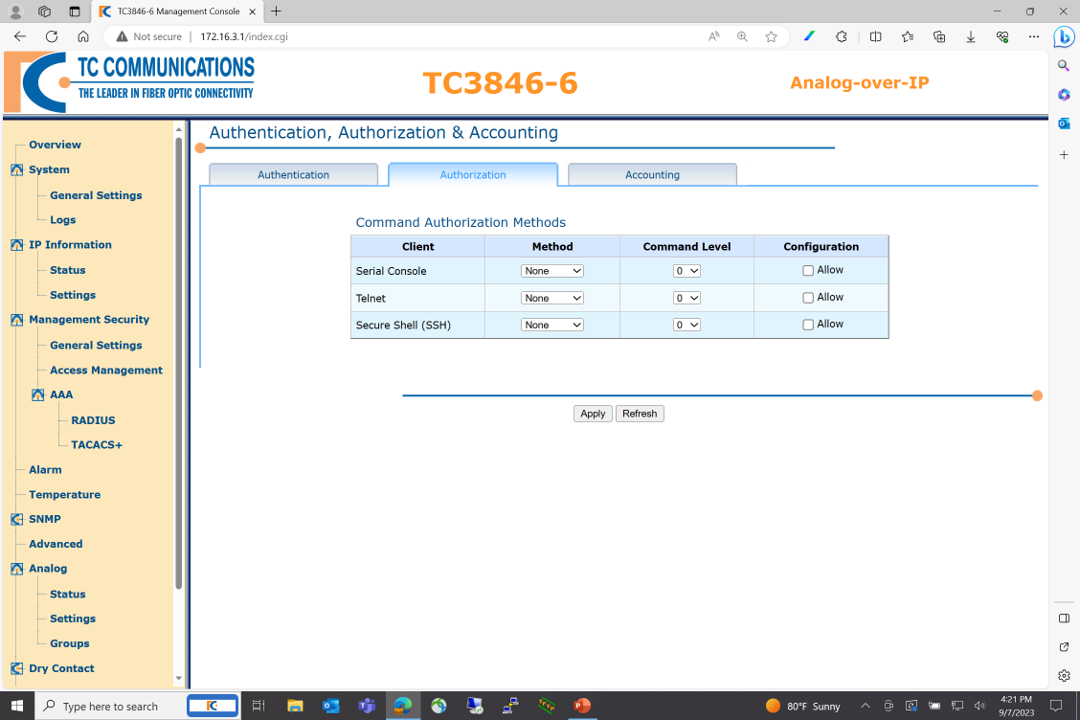
You can also enable or disable certain features by navigating the “AAA” (Authentication, Authorization, and Accounting) sub-tab under the “Management Security” tab on the left-side menu. For example, many users might prefer to have Telnet disabled, which you can accomplish in “Authorization” tab (see below):
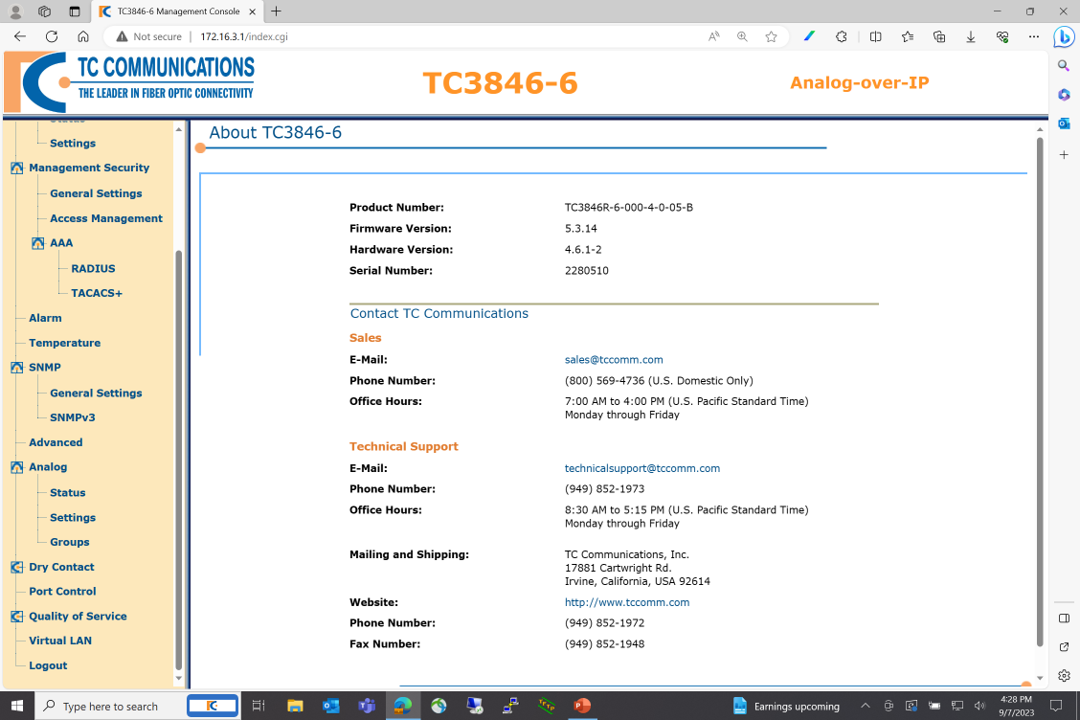
If you run into any issues with configuration or operation, there is a product information page which provides not only the full details of your equipment, including the product number, firmware version, and serial number, but also the contact details for technical support.
To find this page, navigate to the “Advanced” tab under the SNMP tab from the left-side menu, then click the leftmost “About” icon, which will take you to the product details page (see below):
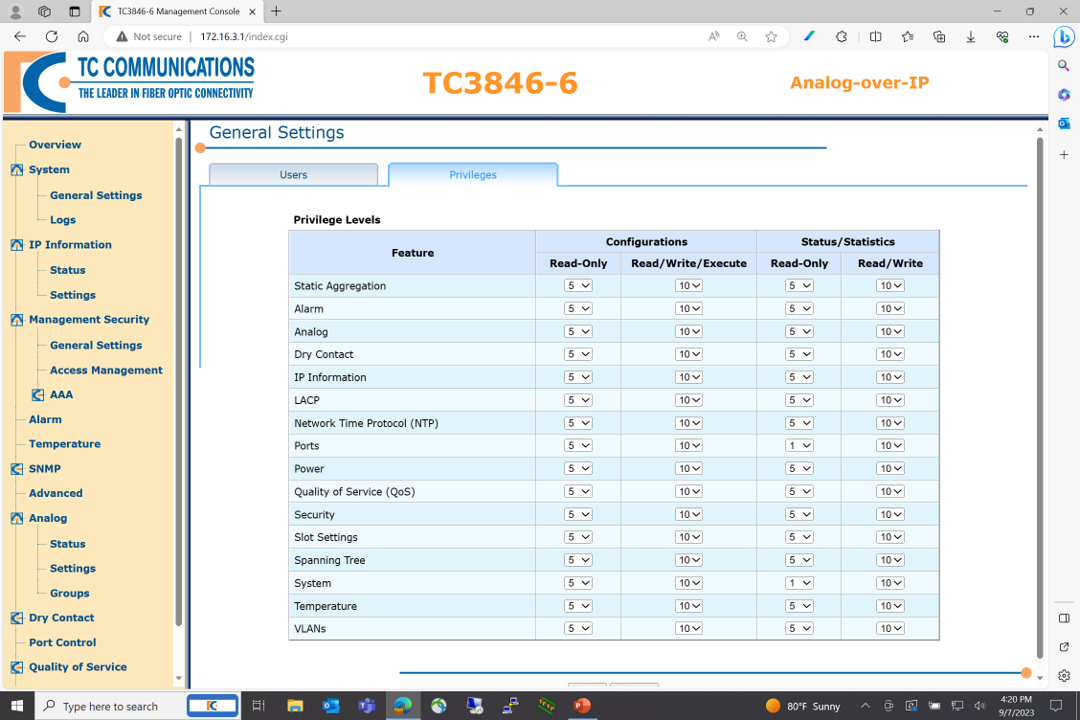
Security
Finally, security is a top priority. For one thing, the graphical user interface is fully password protected. For another, you can limit users to certain admin rights. In other words, you can grant access to some elements of monitoring or configuration to certain users in your organization, but not to others.
You can create a series of users by granting them varying privilege access (admin) levels. Then, you can take it a step further by assigning every feature in the unit a specific access level.
There are ten levels of admin users. Users can access any features at their same admin level or a lower admin level, but not at a higher level. This cumulative approach to permissions makes it convenient for higher-level users to access every feature they might need, even ones they only interact with on occasion, while neatly restricting access for lower-level users.
To read other JumboSwitch articles from this series, visit the JumboSwitch Monitoring Series page.
Interested in similar content? Subscribe to our mailing list.